A service audit in four hours, not four weeks
The traditional fixed-ops engagement runs like this: two days on site, two more weeks building slides, one deck delivered — and three months later the findings are a memory. Lens restructures the workflow so the analysis happens during the visit and the report is ready the same day. The consultant's judgment stays central. The grunt work is handled.
Step 1 — Ingest the data
Pull an RO export from the DMS — CDK, Reynolds, Tekion, Dealertrack, or any system that exports CSV. Add the inspection completion log and call data if available. Lens ingests it in minutes. For dealerships on BayWise Scheduler, live data flows in without an export step.
The Fixed Ops Representative uploads three months of RO data before the morning meeting. By the time the service manager arrives, the declined-service rate and MPI completion breakdown are already on screen.
Step 2 — Diagnose and size the findings
Lens surfaces patterns the data already contains: declined-service capture rates by advisor and category, MPI completion rates by shift and time of day, call-answer rates and callback follow-up discipline. Each pattern is sized in currency — not "this is an opportunity" but "$1.4 million per year at this volume."
The consultant adds three qualitative observations from the floor walk directly to the canvas. Lens connects them to the quantitative RO data and sizes the combined impact. The conversation with the Dealer Principal that afternoon is about numbers, not impressions.
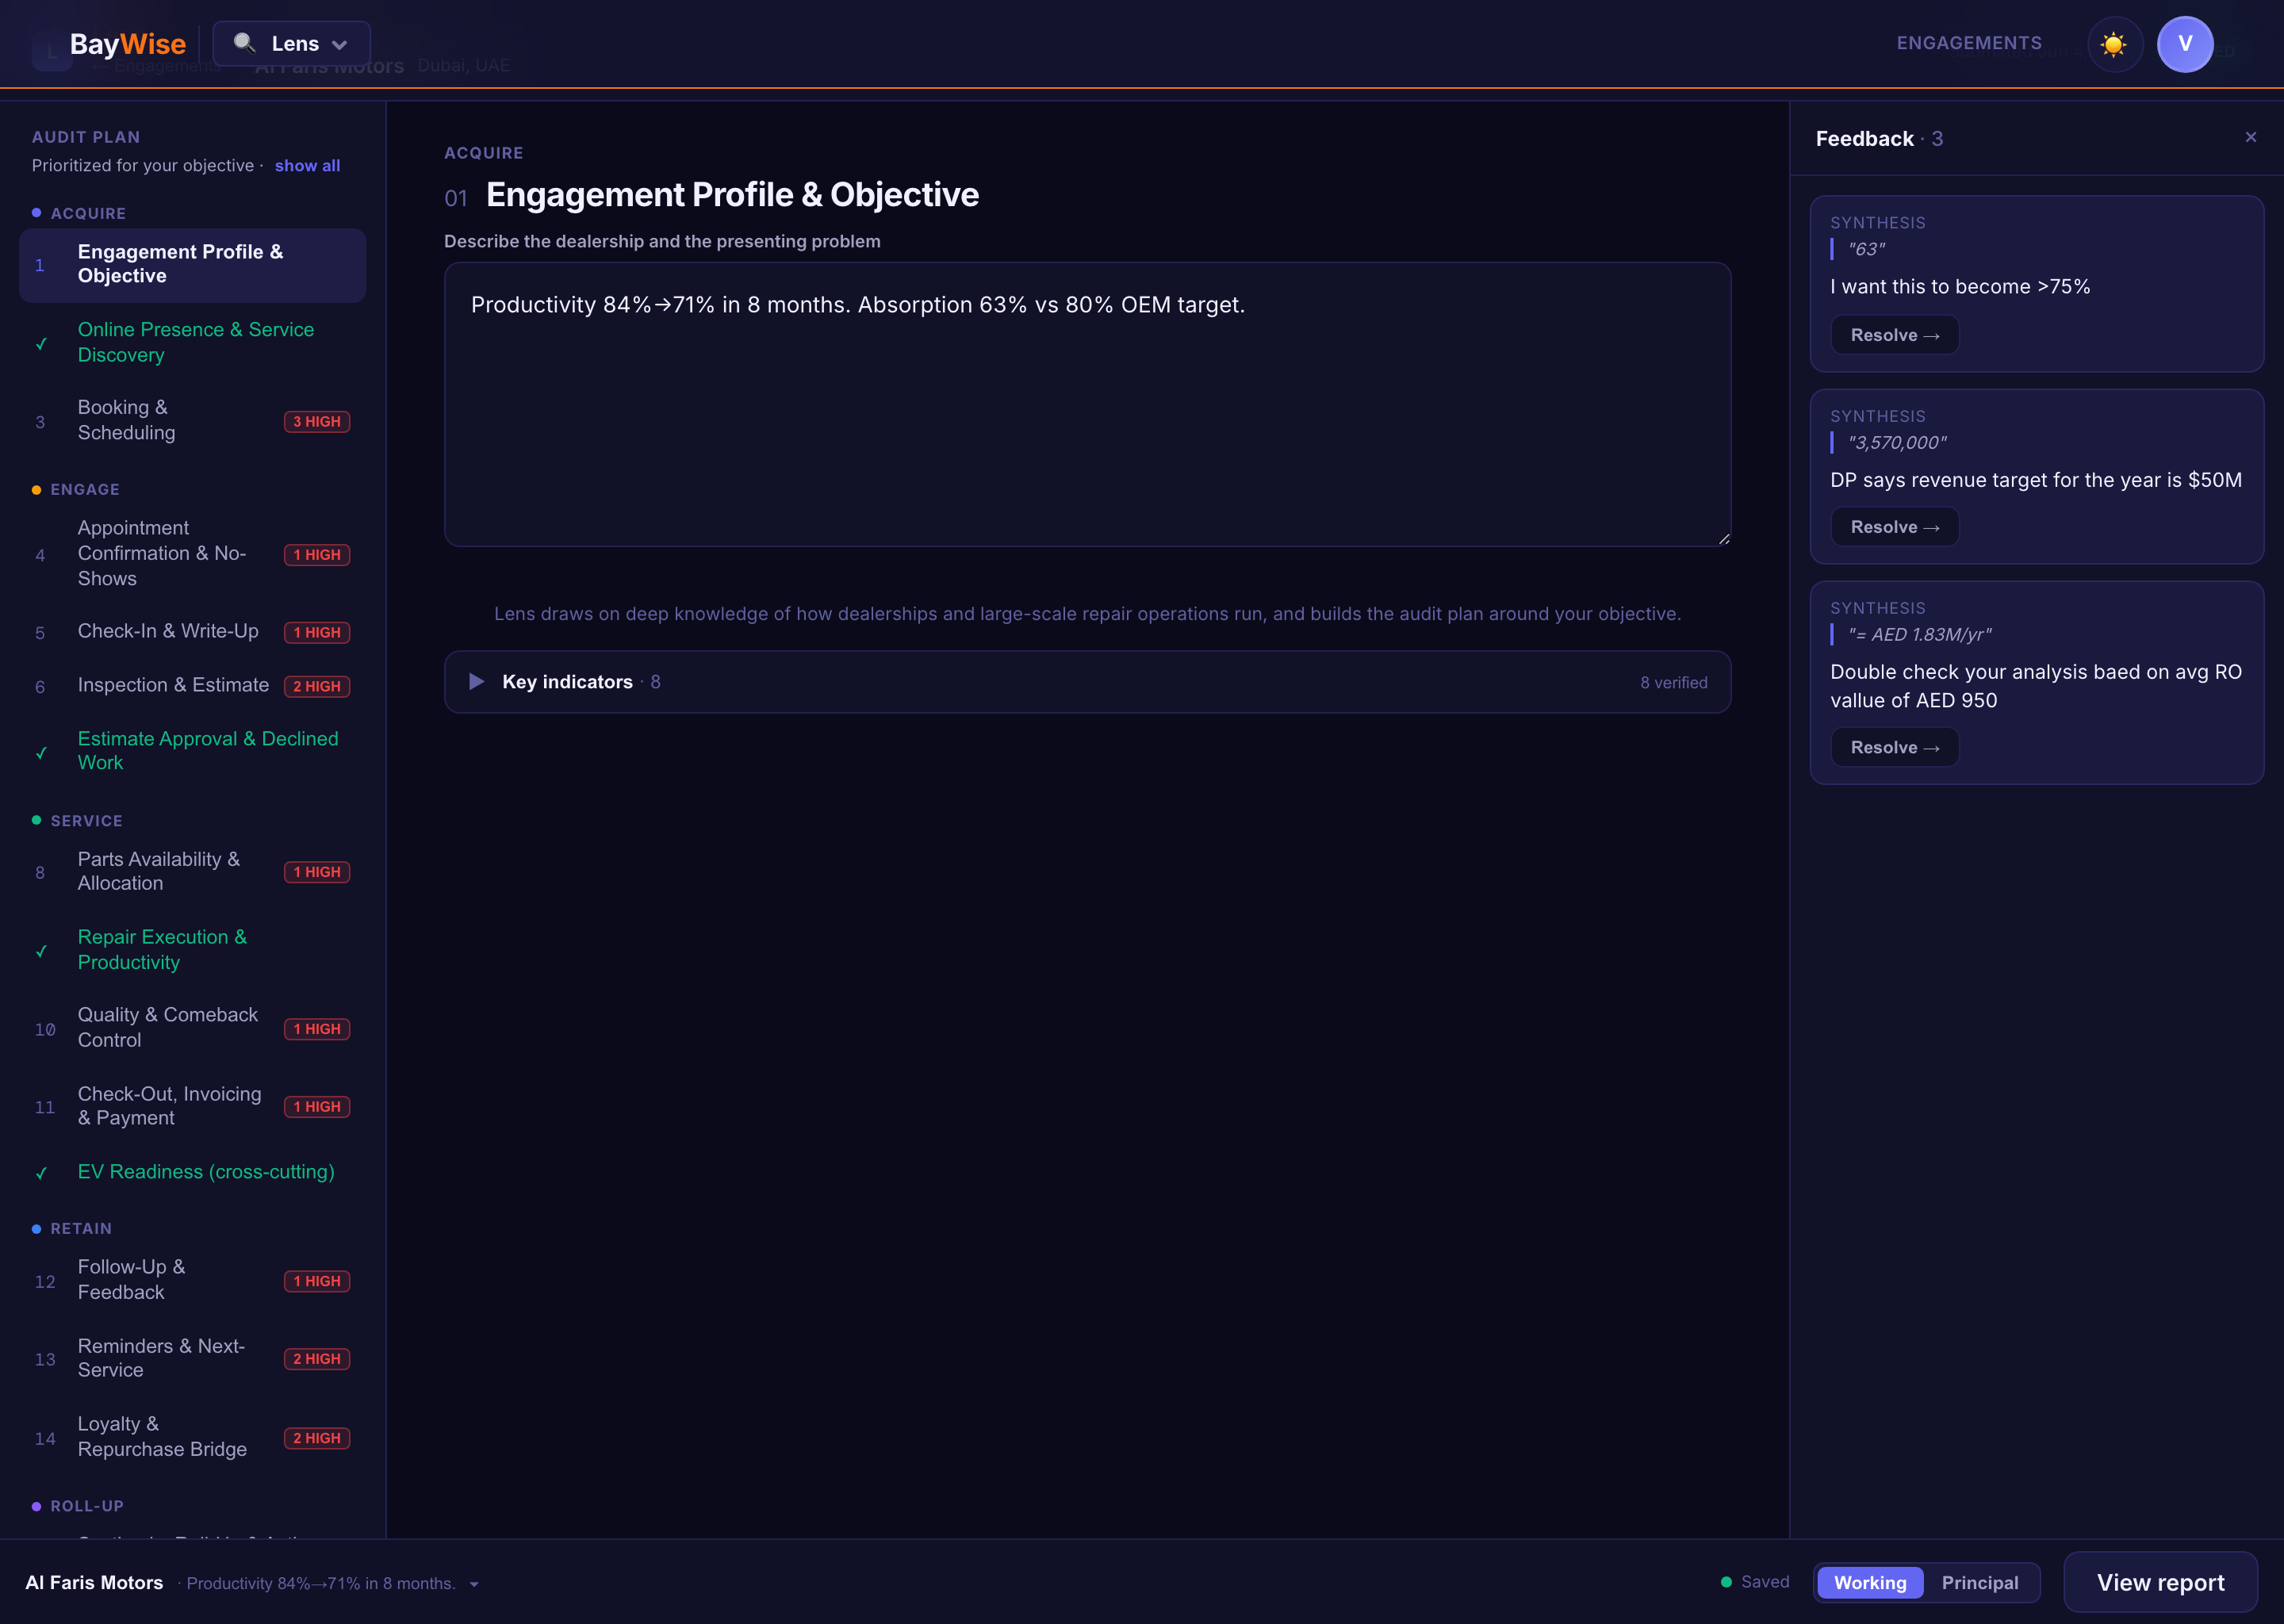
Step 3 — Deliver the plan
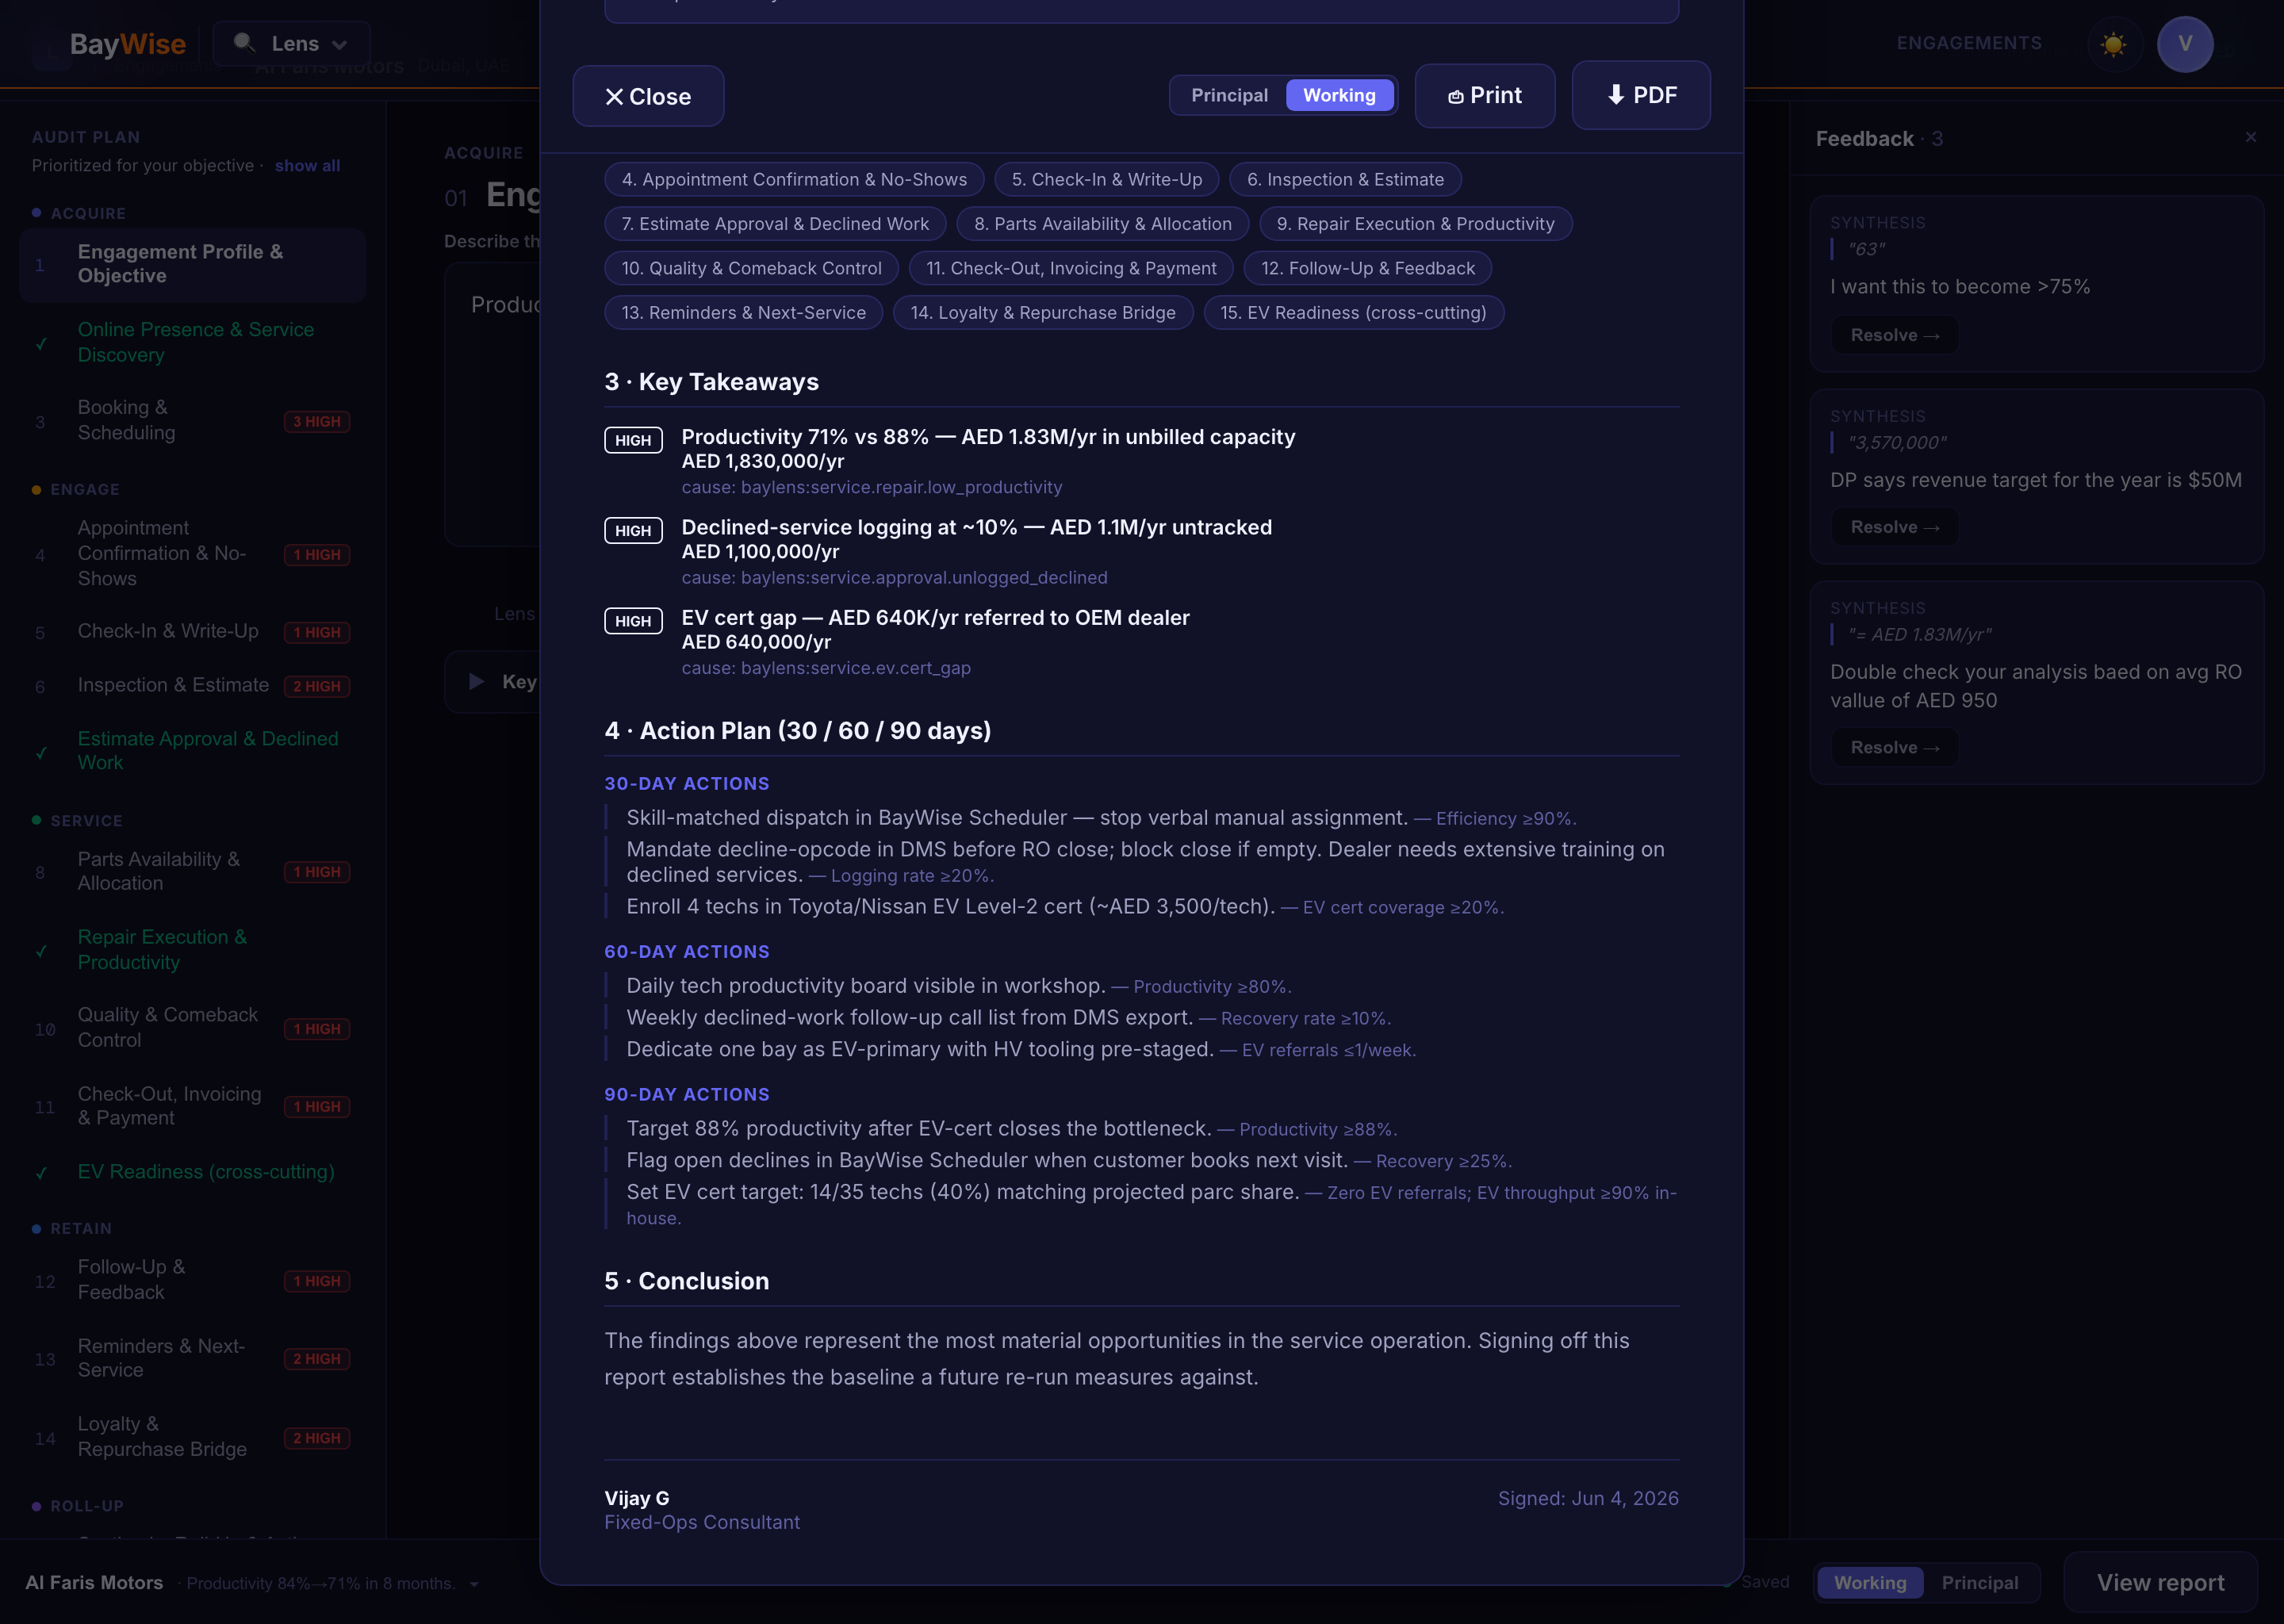
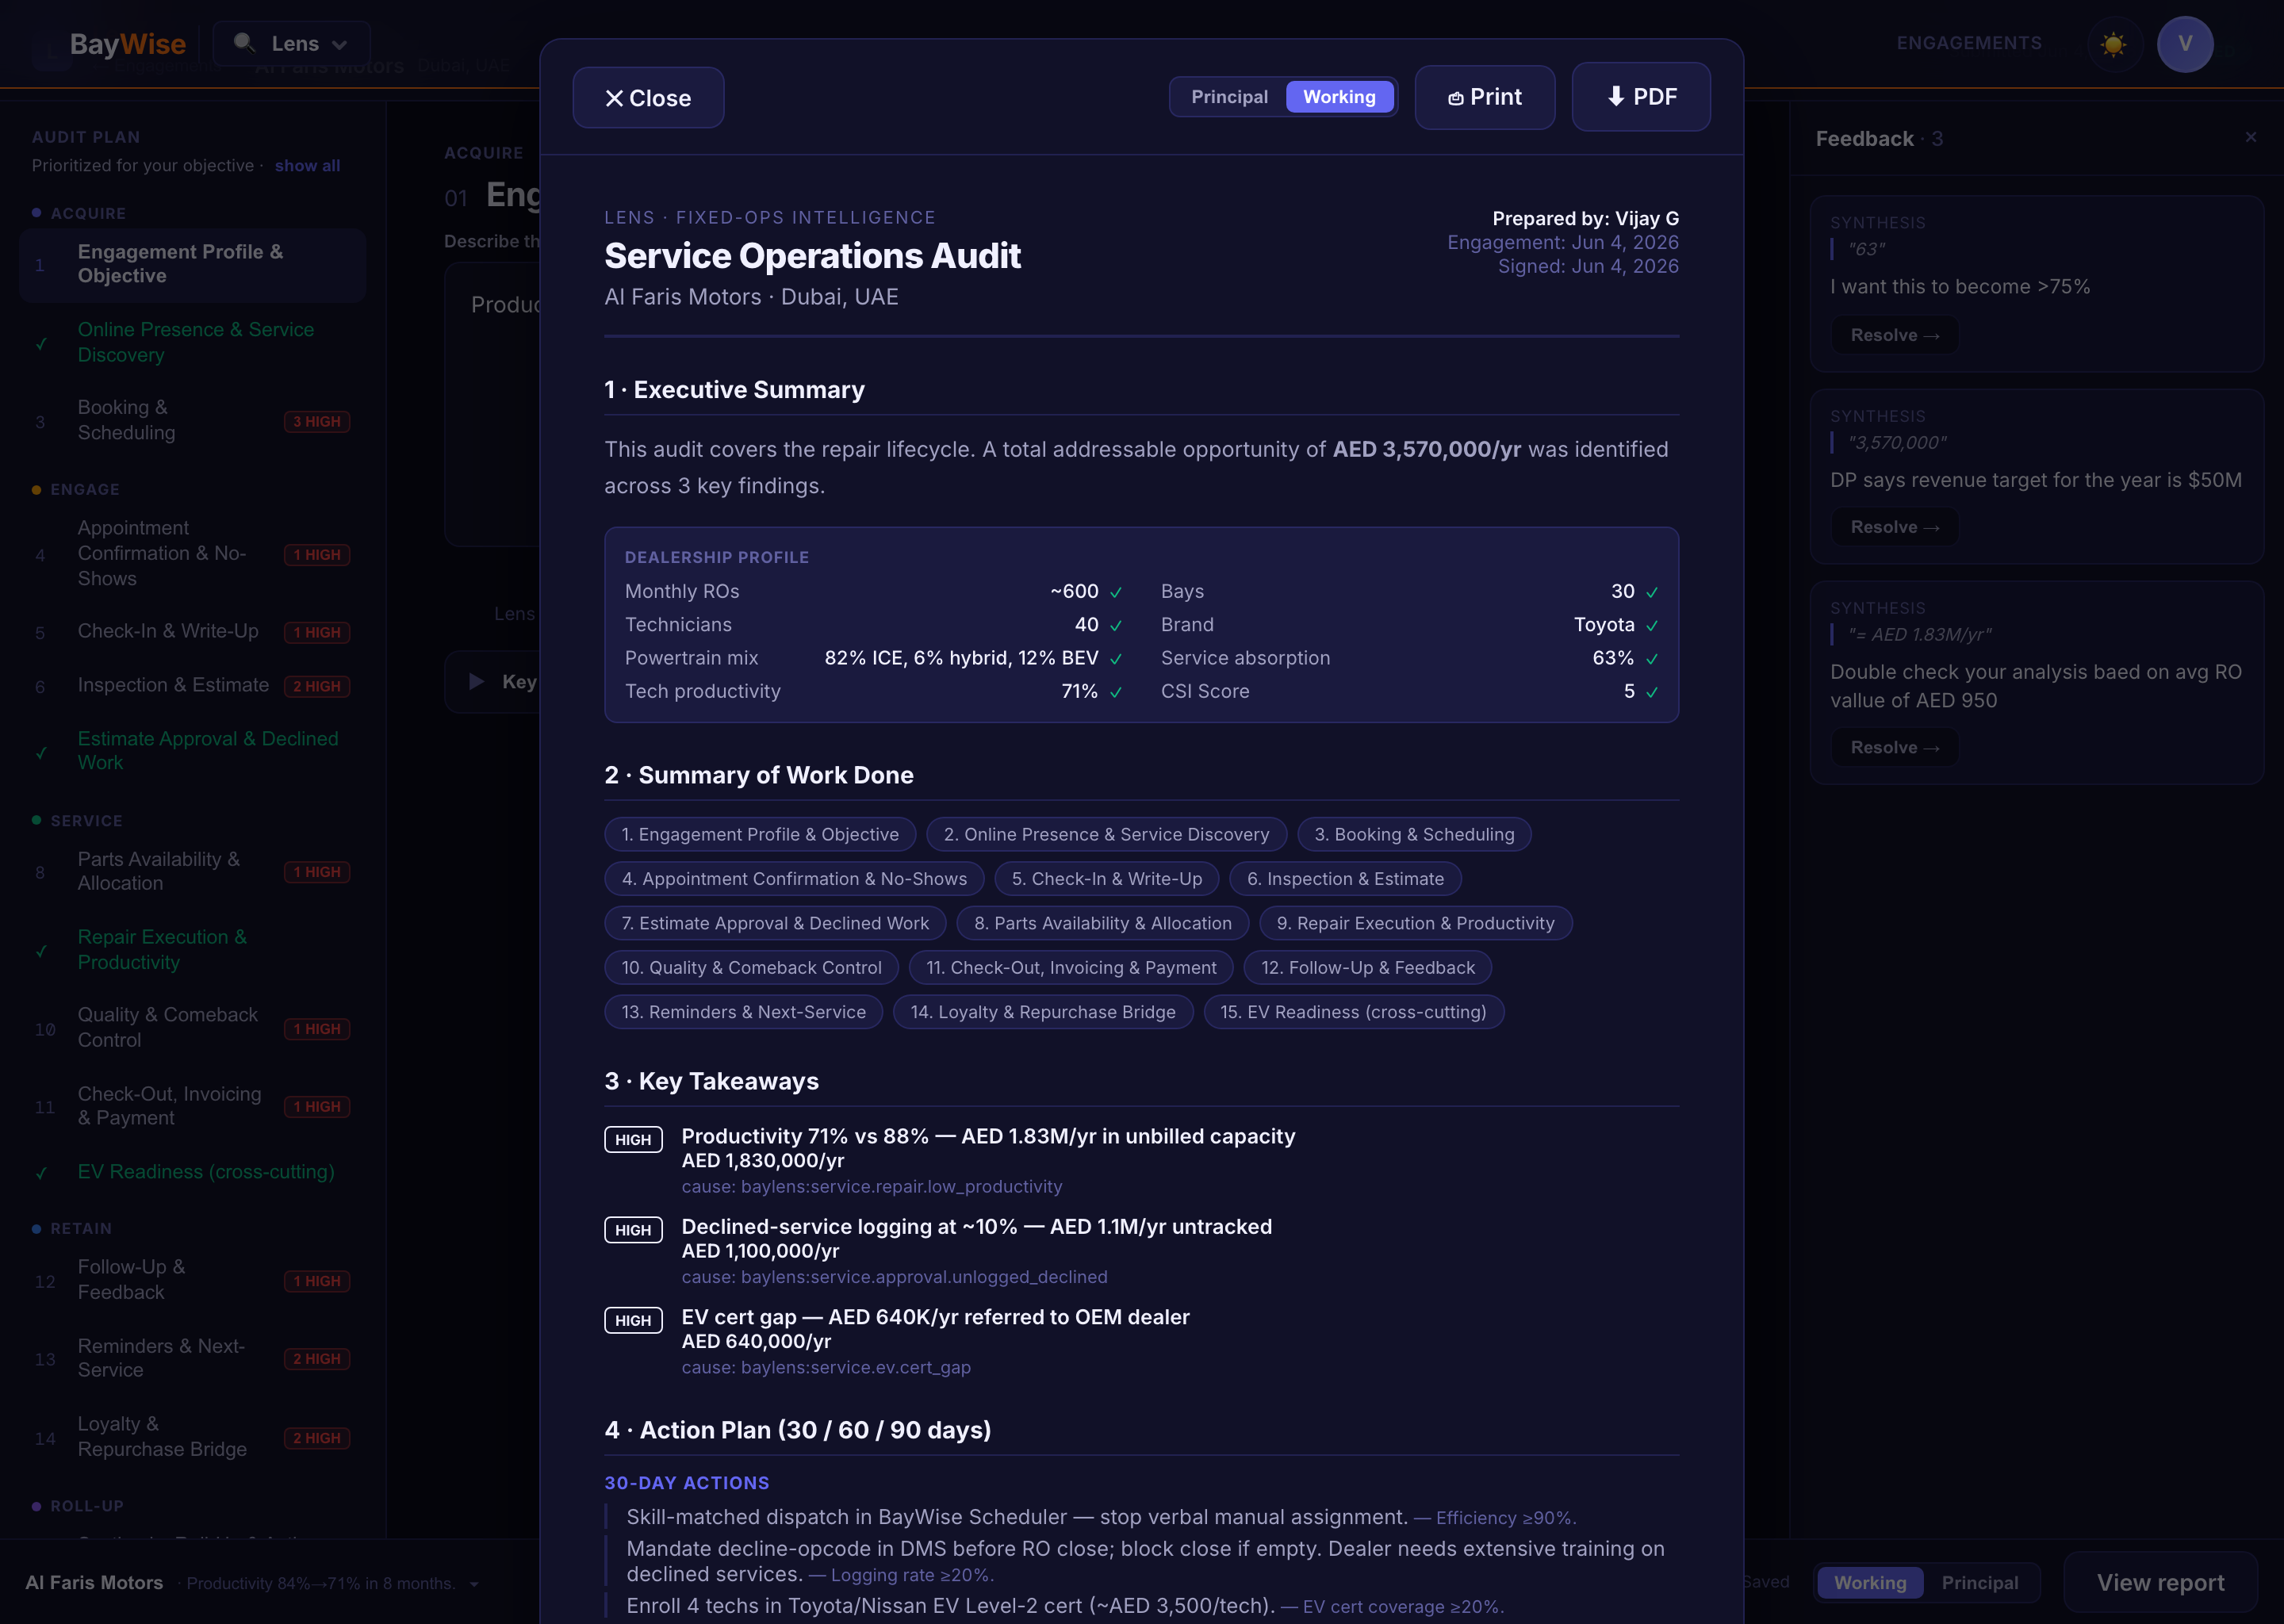
Lens sequences the findings into a 30/60/90 action plan — quick wins first, structural changes by 60 days, systemic improvements by 90. Each action has an owner and a measurable target. The branded PDF report carries the consultant's logo and narrative, with Lens handling the structure, evidence layout, and benchmark comparisons.
At a franchise service centre in Germany, the engagement was complete by 4pm on day one. The Fixed Ops Director presented the report to ownership the next morning. Three months later, the declined-service capture rate had moved from 8% to 22%.
Everything a dealer service audit needs to move from opinion to evidence
Audit Canvas
A structured workspace where the consultant captures findings from RO data, inspection sheets, and call logs. Every observation is tagged to a revenue category — not lost in a notebook or buried in a slide deck.
Without it: findings stay in the consultant's head or scattered across slides, impossible to track or compare across engagements.
Revenue Leak Quantification
Each finding is automatically sized in currency. 300 vehicles a month leaving without a documented inspection opportunity is not a process observation — it is $75,000 in potential recommended work. The Dealer Principal sees the number, not the opinion.
Without it: the consultant says "you're leaving money on the table." The dealer nods and changes nothing.
AI-Assisted Pattern Recognition
AI surfaces patterns across RO data, inspection completion rates, call logs, and declined services — the signals a veteran dealer-development consultant notices after 500 engagements. Junior consultants get senior-level insight. Seniors move faster.
Without it: the consultant's experience is the bottleneck. The quality of the audit depends entirely on who shows up.
30/60/90 Action Plan
Findings are sequenced into a prioritised action plan — quick wins in 30 days, structural fixes by 60, systemic changes by 90. Each action has an owner and an expected impact. The dealer knows exactly what to do Monday morning.
Without it: the report lands and nothing changes. No owner, no sequence, no follow-up accountability.
Branded PDF Report
A consultant-ready report with your logo, your firm's colours, your narrative. Lens handles the structure, the evidence, and the numbers. You own the client relationship. Delivery time drops from 2 days to 2 hours.
Without it: 40% of engagement time goes to formatting slides. That's two days of billable hours lost to PowerPoint.
Benchmark Comparison
Every finding is benchmarked against best-in-class and average dealers in the same segment, market, and vehicle type. The absorption rate gap is the argument for change. The benchmark is proof the gap is real.
Without it: the dealer argues back. With benchmarks, the data argues for you.
Engagement Tracking
Track findings, actions, and progress across the full engagement lifecycle. Follow-up visits compare current state to the original audit — giving the consultant measurable evidence of value delivered before the next retainer is discussed.
Without it: the consultant can't prove ROI on their own work. Every re-engagement is a new sale.
Multi-Rooftop Portfolio
For OEM field representatives and MSO operators: run structured audits across a portfolio and rank locations by absorption rate, declined-service capture, and MPI discipline. The worst performers no longer hide in the average.
Without it: each rooftop visit feels like the same problem. The outlier who needs the most help looks like everyone else.