Your biggest profit centre. Your least audited one.
Service and parts generate more net profit than every new vehicle sold — yet most dealer groups measure service performance by anecdote, manager feel, and a DMS report nobody reads past the first page. The gap between a 58% absorption rate and a best-in-class 100% is measurable, diagnosable, and fixable. BayWise Lens is the diagnostic reasoning engine that finds it — findings sized in currency, a 30/60/90 action plan the team can execute, a branded report the Dealer Principal can act on.
The alternative to the spreadsheet audit that takes four weeks and proves nothing.
Free first audit · No credit card · No DMS integration required
The highest-margin part of the dealership is running on gut feel
Your service department's revenue leaks are not a mystery. Declined services leave a trace in the DMS. Incomplete inspections show up in RO data. Unanswered calls exist in the call log. The patterns are all there — but nobody has pulled them together, sized them in currency, and put a 90-day plan behind them. Until now.
Service absorption rate — and why most dealer groups are leaving profit on the table
Service absorption rate measures how much of the dealership's fixed operating costs are covered by service-and-parts gross profit. At 100%, all vehicle sales are pure profit. Most public dealer groups sit at 54–66%. The gap is measurable, diagnosable, and fixable.
% of fixed operating expenses covered by service & parts gross profit
Three things change when the audit has a number behind every finding
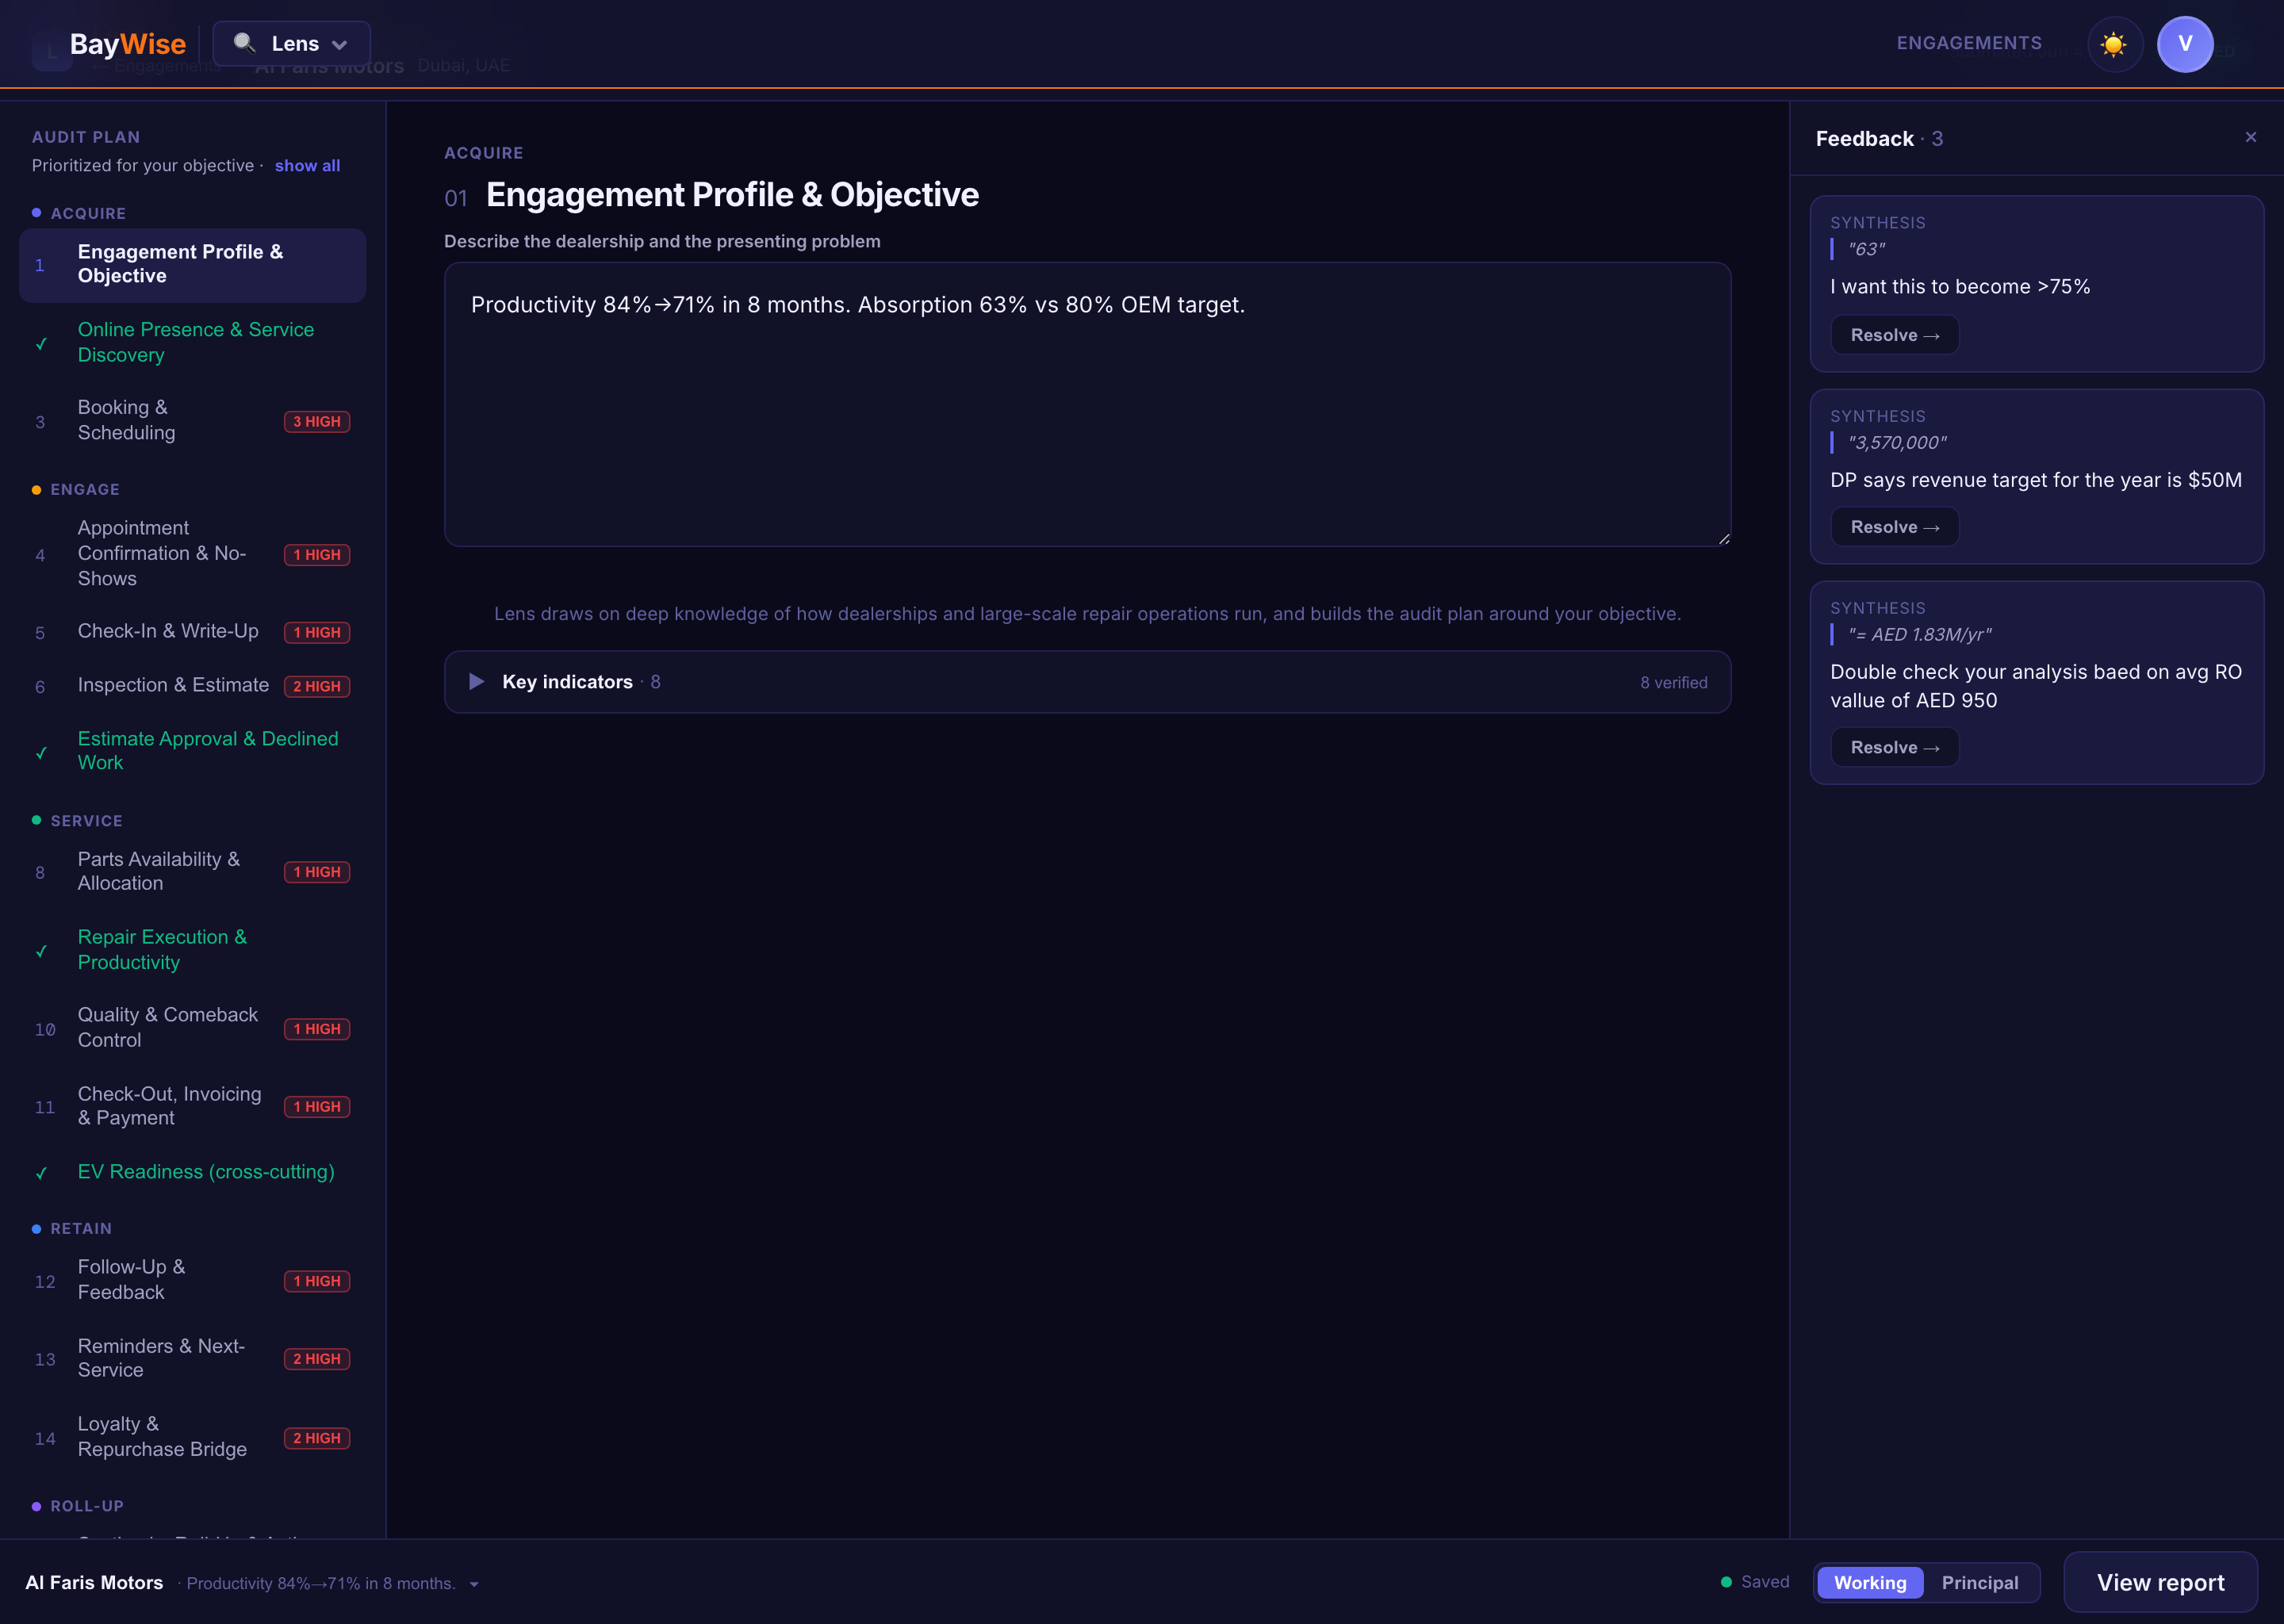
Audit Canvas — structured finding capture with revenue tagging
Everything a dealer service audit needs to move from opinion to evidence
Audit Canvas
A structured workspace where the consultant captures findings from RO data, inspection sheets, and call logs. Every observation is tagged to a revenue category — not lost in a notebook or buried in a slide deck.
Without it: findings stay in the consultant's head or scattered across slides, impossible to track or compare across engagements.
Revenue Leak Quantification
Each finding is automatically sized in currency. A 7% declined-service capture rate on 400 ROs/month is not a process observation — it is $1.4M in recoverable revenue per year. The Dealer Principal sees the number, not the opinion.
Without it: the consultant says "you're leaving money on the table." The dealer nods and changes nothing.
AI-Assisted Pattern Recognition
AI surfaces patterns across RO data, inspection completion rates, call logs, and declined services — the signals a veteran dealer-development consultant notices after 500 engagements. Junior consultants get senior-level insight. Seniors move faster.
Without it: the consultant's experience is the bottleneck. The quality of the audit depends entirely on who shows up.
30/60/90 Action Plan
Findings are sequenced into a prioritised action plan — quick wins in 30 days, structural fixes by 60, systemic changes by 90. Each action has an owner and an expected impact. The dealer knows exactly what to do Monday morning.
Without it: the report lands and nothing changes. No owner, no sequence, no follow-up accountability.
Branded PDF Report
A consultant-ready report with your logo, your firm's colours, your narrative. Lens handles the structure, the evidence, and the numbers. You own the client relationship. Delivery time drops from 2 days to 2 hours.
Without it: 40% of engagement time goes to formatting slides. That's two days of billable hours lost to PowerPoint.
Benchmark Comparison
Every finding is benchmarked against best-in-class and average dealers in the same segment, market, and vehicle type. The absorption rate gap is the argument for change. The benchmark is proof the gap is real.
Without it: the dealer argues back. With benchmarks, the data argues for you.
Engagement Tracking
Track findings, actions, and progress across the full engagement lifecycle. Follow-up visits compare current state to the original audit — giving the consultant measurable evidence of value delivered before the next retainer is discussed.
Without it: the consultant can't prove ROI on their own work. Every re-engagement is a new sale.
Multi-Rooftop Portfolio
For OEM field representatives and MSO operators: run structured audits across a portfolio and rank locations by absorption rate, declined-service capture, and MPI discipline. The worst performers no longer hide in the average.
Without it: each rooftop visit feels like the same problem. The outlier who needs the most help looks like everyone else.
The leak is bigger than anyone thinks — and it is in the data
A rooftop doing 400 repair orders per month with a 7% declined-service capture rate is leaving more than $1.4 million in recoverable revenue on the table every year. That is not a management consulting opinion. It is a maths problem. The inputs come from the DMS. The answer comes from Lens.
How much is leaking at this rooftop?
Enter the dealership's monthly repair order volume and average revenue per RO. The leaks are diagnosed from your data — these are conservative estimates from documented industry benchmarks.
Conservative estimates based on industry benchmarks: declined-service capture rates from published DMS studies; MPI gap data from TVI Inc. analysis of 300-vehicle/month rooftops. Actual recovery depends on engagement execution.
One platform, every workshop type
Whether you run 5 bays or 500, BayWise adapts to your operation.
Fixed-Ops Consultant
Independent or firm-based. Runs 8–15 dealer engagements per year. Spends two days building a report that should take four hours. Knows exactly where the money is — but can't prove it fast enough to win the next engagement.
OEM Dealer Development Rep
Manages 20–80 rooftops. Visits each dealer 2–4 times per year. Cannot compare performance across the portfolio from memory. The dealer hiding a 58% absorption rate inside an average-looking scorecard is the one who needs the most help.
MSO / Dealer Group COO
Runs 10–50 locations. Knows fixed ops is where the margin lives but has no systematic audit tool. Currently relies on GM self-reporting — which is optimistic by design.
Dealer Principal (Internal Programme)
Progressive dealer groups are building internal fixed-ops audit capability — hiring a Fixed Ops Director who conducts structured reviews across the portfolio on a rolling basis, without depending on external consultants for every engagement.
The gap between knowing and proving just closed.
Every fixed-ops consultant knows where the money is. Now you can show it — in currency, in sequence, in a report that holds up in a Dealer Principal's office.
No credit card. No sales call. Run your first audit free.